Data machine software improves investment efficiency for humans by 1%
Data machine software®
Data machine software download
Contact Us
Data machine software is a professional machine for processing data. Machine requirements: Strive for excellence, simple yet efficient

Introduction to Data Machine Software:

     A data machine is like a printer. If you provide it with data, it will give you a visual chart that allows you to see the patterns of the data,

He will be a good helper for you to handle data. The main function of this machine is to assist human investment and decision-making.

    This software is currently divided into four menu bars. The first bar is for analysis, the second bar is for Simplicity is powe, the third bar is for reducing uncertainty, and the fourth bar is for seeing the future.

     Qualify irregular data, quantify qualitative data, regularize quantitative data, and determine regular data to help machine owners reduce risks in investment decision-making,   The purpose of increasing profits.

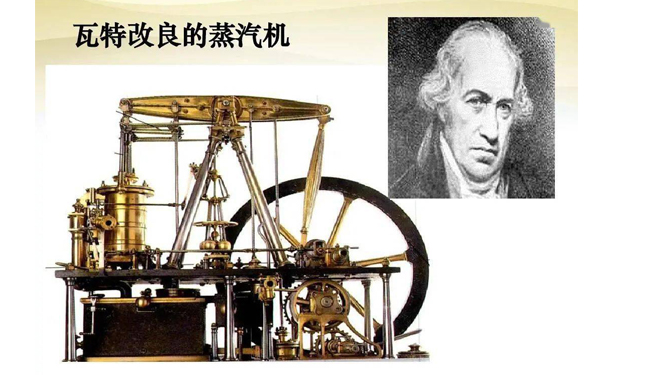
     The pursuit and principles of data machines: Just like Watt's improvement of the steam engine, constantly improving data machines to contribute to the advancement of humanity, the standard of our software functionality, Do what is beneficial for promoting human progress, and do not do what is detrimental to human progress
data tracking

Keyword statistics

Data synthesis chart

Violin Matrix Diagram
Introduction to Data Tracking:
   The user opens the data in the Excel table,
   Generate polynomial function graphs from data, Then subtract the predicted data from the actual values,
  Generate a function graph of the difference
Wealth Visual Introduction:
   User inputs remaining life months,
   The amount that needs to be spent each month,
   Cost of risk prevention,
Output the monthly fees that need to be earned,
   Total required expenses
Calculate probability:
  Due to the ease of calculating extreme values,
  User input success probability, number of attempts
  Determine the likelihood of all successes,The possibility of complete failure,At least one possibility of success,The possibility of at least one failure
Dissecting Stock Data:
   User opens data in Excel,
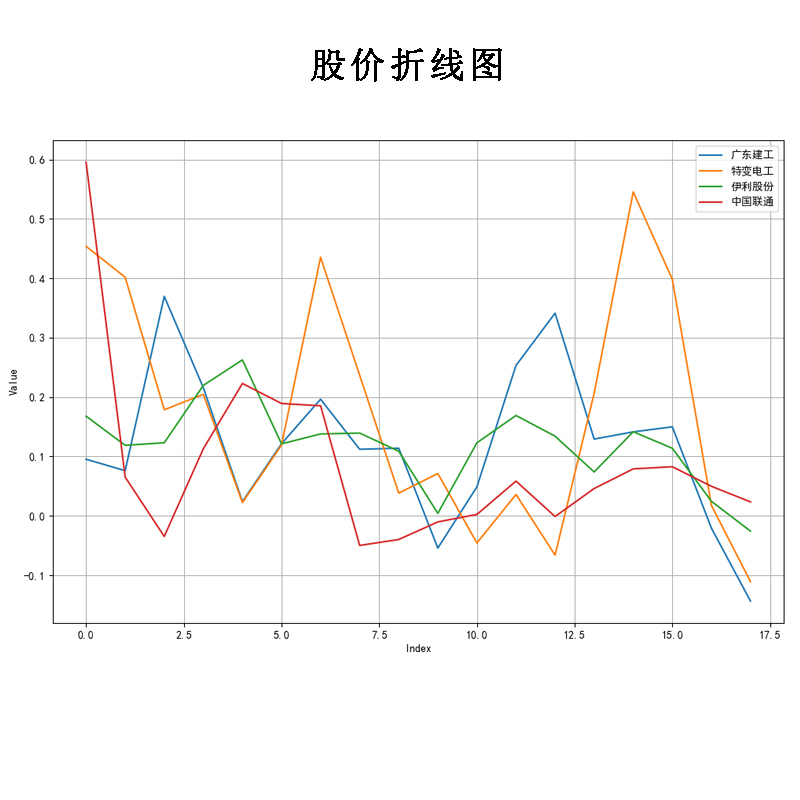
Form a line chart of each column of data,
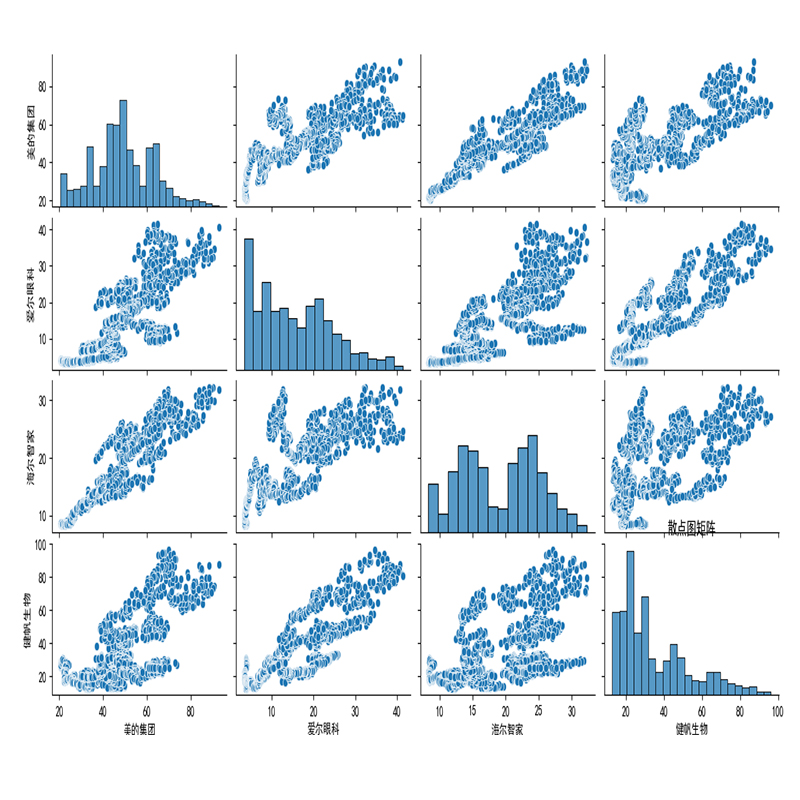
boxplot,Violin Diagram,Correlation diagram,Make the data clear at a glance
Calculate investment return rate:
   User inputs initial cash investment,
Cash flow of income for each period,
Output the annual rate of return during the investment period
Assessing Financial authenticity:
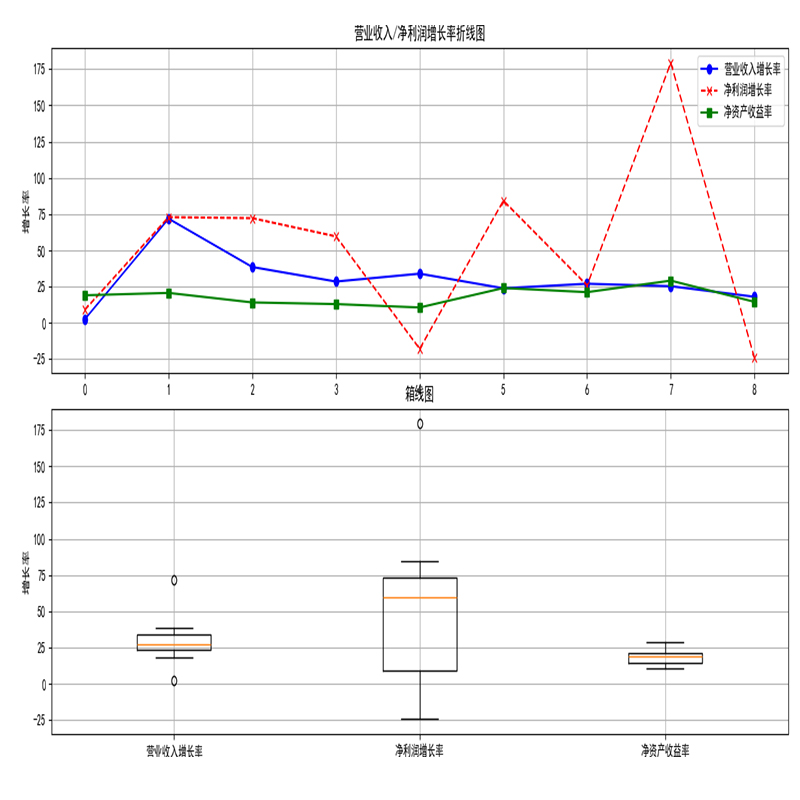
   User inputs annual revenue,Net profit,net assets,Output average annual operating revenue,Net profit, net assets,By calculating the coefficient of the relationship between operating income, net profit, and net assets,Assessing the authenticity of finances

Correlation coefficient hotspot map

Life Calculator
 VGA转HDMI
Wealth Calculator

Common data output

line chart

Scatter Matrix Diagram

Judging the Growth Cycle Chart of Enterprises

boxplot
1.How to calculate the relationship between life and wealth?
2. How to determine the lifecycle of a company?
3.How to quickly determine the authenticity of the financial situation of listed companies?
4. How to do the right things in different stages of life ?
5. How to Use Calculus to Process Stock Price Trends?
6.How to clarify the relationship between risk and return?

Strive to improve data machines for humanity
A: analysis

B:Simplicity is power

C:reduce uncertainty

D:see the future

E:Create history

F:Serving humanity
Franchise cooperation Contact Us Customer service phone number (Mr. Xie) Tel:15084885955
Hunan ICP No. 2020016998  URL:www.xm654.com  Website Name:Data machine software